Sometimes you need to know the number of connections from a server to other one to understand how both boxes are talking. I like to use WireShark tool to troubleshooting the network problems reported by servers managed by us, it is a very good tool with many of functionalities that could make your life more easy.
In this case, if you try to know the number of connections using the standard list reported by WireShark it is possible you make crazy, this list provide a description of all packets changed between both servers, but as you know a connection could represent a big number of packets so you can use this information to respond your answer.
The first step is to get the report with all traffic, to do it you can run WireShark, click on Capture menu and select Interfaces…
Click on the Options button of the network adapter that is providing the external communication (usually the one with higher number of packets):
On the Capture Options window, uncheck “Capture packets in promiscuous mode” and check “Enable network name resolution”:
If you check “Capture packets in promiscuous mode” WireShark will capture all the traffic in the Network VLAN independently if it is generated/received by your server or not. So it will reports many many entries in your report that are not useful for you and, from a Security point of view, if your Network is configured correctly when it detects that a device is listening all the traffic in the VLAN, the entire VLAN will be down to avoid a “man-in-the-middle” attack.
You can uncheck “Enable network name resolution” if you prefer to work with IP addresses, but with this option check your report will display the DNS name of each server, so it will make the analysis more confortable.
Click on Start button to start the capture. Stop it when you want clicking on the Stop icon:
Click on Expression… button to apply a Filter expression or type it on the Filter field. Some of the filter expressions I like to use are the followings:
app.addr == 10.111.23.3 (to filter all traffic from/to server with IP 10.111.23.3)
Kerberos (to filter all Kerberos traffic)
Now that you have the capture filtered, you can see all the traffic packets that interest you, but you can see the connections.
Click on Statistics menu and select Conversations:
On the Conversations window select “Limit to display filter” to get the conversations that just comply with the filter expression typed by you. And click on TCP tab to see the connections:
On this view you can see many interesting information like the number of packets moved in each direction, the start time of each connection, the duration of each one, etc. etc.
If you click on Copy button you will move the data to your clipboard.
Then, you can open Excel and paste the clipboard content. All the data is paste in just one column, so to make it readable you can click on Data tab in your Excel client and click on Text to Columns button (I am using Excel 2007 but this option exist from Excel XP):
On the next window, select Delimited option and click on Next:
On the next window, select Tab and Comma as Delimiters, and click Finish:
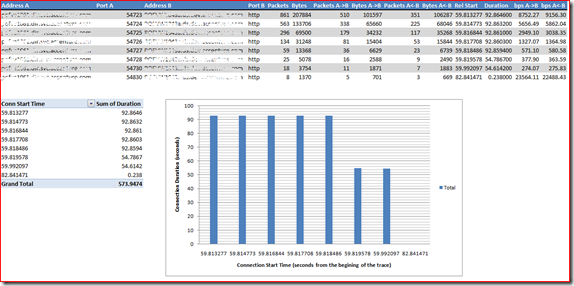
Now you have a table similar to the one displayed by WireShark on Conversations window. Playing with this info you can, for example, click on Insert tab and select PivotTable –> PivotChart and create a very good report to send to your customers:


![clip_image001[5] clip_image001[5]](https://blogger.googleusercontent.com/img/b/R29vZ2xl/AVvXsEiqfJiRaMQHWY1C8ZZ-6GxInB7I3RXui5gUeLvoSnZSBIFmrKJd0Y7_lXrhronnygObe5ABDadXhsBMaOwzpIytpnYmQlrnsNeE1KpzRbZ4BtPwaLIJGKLpQ_MJlVoNyAvxjrftvt66jpc/?imgmax=800)

![clip_image001[10] clip_image001[10]](https://blogger.googleusercontent.com/img/b/R29vZ2xl/AVvXsEgzIm5_R8TWG-JXrcr-P9-pc6H6iutP2K5DQM_JIN_3v9XC7_zsXplWsbAZ9hn7ha_ItSXC0NbHVsecdMRVsmXzfd2g3xeqOvzbWdONPD7ReegJRDpo5T31B9xFLAXmtlT9hN_bMEjhvz8/?imgmax=800)


No hay comentarios:
Publicar un comentario